

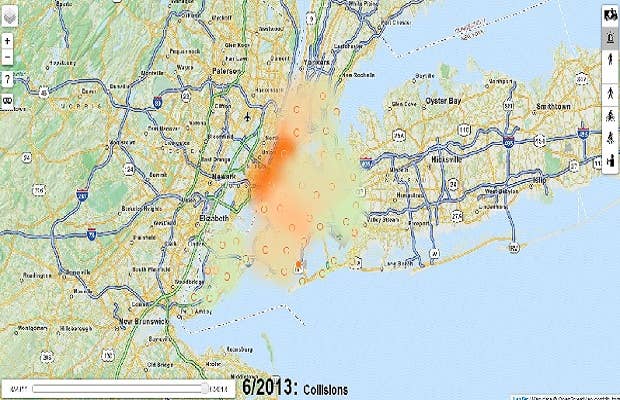
Two years ago, New York City Council began pushing the NYPD to share monthly collision data. Now, thanks to John Krauss'NYC Crashmapper, you can vizualize crash information and indentify specific areas in the city where they're likely to occur.
The freelance webdesigner created the heat maps that provide information about driver injuries, pedestrian injuries, cyclist injuries and crashes where no one was injured. In addition, it highlights monthly crash sites dating all the way back to August 2011. It's a useful tool for everyone, especially those curious to see how many people are injured at traditionally dangerous intersections.
[via Gothamist]